Making a Case for Energy Monitoring
Monitoring a building’s real time energy consumption is a good way to reduce demand and identify energy conservation measures.
April 27, 2016

By Abhay Ambati
Traditionally, the steps used to reduce the energy footprint of buildings follows a sequence of steps: retro-commissioning, energy audit, energy retrofit, deep energy retrofits, measurement and verification, operations, and maintenance. From an economic standpoint, each step requires the building owner to allocate substantial up-front capital by preplanning the expense, using a sinking fund, or pulling capital from contingency reserves. More often than not, due to the relative risk and hassles involved in allocating capital up-front, energy efficiency reduction measures are pushed back in place of other critical expenses.
Based on experience with designing and deploying energy monitoring systems, I strongly believe that most energy efficiency measures are low or no cost, which can be generally addressed by a building supervisor or technician. If the owner has further financial motivation to undertake deeper measures, the energy monitoring system provides overall guidance on how to identify deeper measures starting with the low-hanging fruit.
It’s worthwhile to note that although more comprehensive and complicated building management systems (BMSs) are available — systems that integrate energy monitoring with surveillance, lighting, elevators, digital signage, HVAC/mechanical, and even rest rooms — incorporating such features does not make sound financial sense for all kinds of buildings. A fair analogy would be a car dashboard, which gives enough information to the vehicle operator to drive safely and comfortably without any sudden issues. Indicators such as check engine, low tire pressure, low fuel, etc., are sufficient for a driver to take appropriate mitigation measures. Although a more comprehensive dashboard may be more helpful to the driver, the benefit/cost ratio of using such a dashboard can become a concern to the buyer as well as the manufacturer. Consequently, the analogy builds a strong argument to monitor just the load centers in an existing building instead of deploying a comprehensive BMS if the intent of the owner is to drive sustainability goals.
Unlike a car dashboard, buildings are a heterogeneous set, meaning that every building, its energy systems, and its design, etc., is unique. In other words, one type of energy monitoring system will not be physically and economically feasible for an entire portfolio of buildings. As a result, the design, development, installation, and commissioning are a fairly collaborative process that involves the energy monitoring service provider, building supervisor, building owner, energy manager (if any), utility companies (if required), building IT team, installers, and regulatory bodies (if required). Because the process brings together all of the important stakeholders involved in building operations, this process becomes a good first step to initiate sustainability efforts and determine the direction the building operations team will be taking going forward.
After the energy monitoring system is deployed and the stakeholders start receiving building energy and associated analytical information, it’s the responsibility of the project manager to organize a data validation exercise, wherein all the building stakeholders view and evaluate the energy information in real time. This happens to be the most interesting phase of the project because real-time energy information gives startling insights about building health and performance that were previously invisible.
Some of the observations made during data validation exercises on several previous projects are worthy of review. They help point out the value of implementing this type of system. Let’s take a look at some examples.
Case study No. 1
Heating BTUs generated from the building’s solar thermal system on one project showed BTU generation during nighttime hours. Further investigation revealed the solar thermal circulation pump (primary loop) was not working. A work order was issued by the building operations team to fix it. The solar thermal system was designed to offset gas boiler usage for domestic hot water (DHW). A non-functional pump put the entire DHW load on the boilers, thereby increasing gas usage as well as prolonging the payback period of the solar thermal system. Early detection of this issue saved future losses.
Case study No. 2
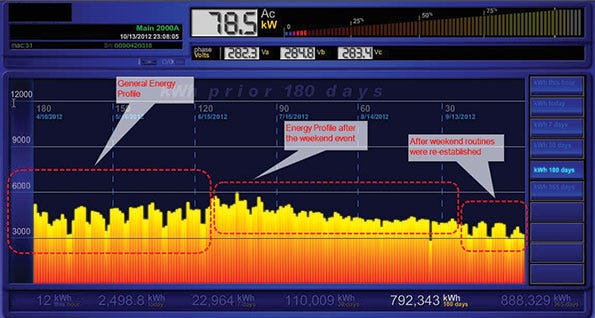
While validating data for a school, a general trend of 20% to 30% reduction in energy usage during weekends as opposed to weekdays was observed. However, this trend changed after some time. The monitoring system revealed a relatively flat energy profile with no considerable drop in energy consumption over weekends (Fig. 1). Because the school is operational on weekdays only, this trend raised a red flag. Further investigation revealed that the thermostat set points and AHU schedules were changed a couple of days back due to a weekend event. However, the settings were never reverted to weekend schedule after the event, hence the flat energy profile. Without real-time energy monitoring, it could have taken a smart building technician a fair amount of time and effort to identify this issue using the utility bills.

Case study No. 3
A highly sophisticated BMS system installed at a campus comprised of five buildings is used to acquire data from building mains and its submeters. After looking at the data collectively, the math simply didn’t add up. The electrical consumption being registered by the building mains meters was not even close to the number calculated by adding the submeters. Closer examination by the building BMS team revealed the DDC wasn’t performing as expected. The BMS had the ability to raise an alert if the metering points were defective. However, the BMS did not have the ability to raise a flag if the sensor detecting electrical consumption at the meter level was not calibrated correctly, which happened to be the issue in this case. The energy monitoring system was able to identify this anomaly.
Case study No. 4
Using a longitudinal benchmarking method to compare current year consumption data to baseline year, it was noted that during one of the peak summer months the current monthly electrical consumption was about 30% lower than baseline year consumption. Interestingly, the cooling degree days (CDD) for current and baseline year were comparable, but consumption was not. On examining the actual electric utility bills of baseline year, a discrepancy was noted. For some reason, the billing total kWh was much higher than the actual metered readings, which led to the jump in consumption and monthly expense. Consumption trending and related analytics indirectly helped identify this billing discrepancy.
Case study No. 5
A common oversight by a building operations team is to assume all building sensors and actuators are working as per design on an ongoing basis. This wasn’t the case at a highly submetered building, where a mild load on the site lighting panel was observed during daytime hours. Though the panels were equipped with photosensors, which would control site lighting (on/off) based on solar irradiance levels, a defective sensor remained undetected. However, the anomaly was easily detected while monitoring individual load profiles and fixed right away.
The previous case studies demonstrate that energy monitoring remains the first line of defense before undertaking more complex steps like retro-commissioning and audits because there are a lot of opportunities to save energy and money in a relatively sound building.
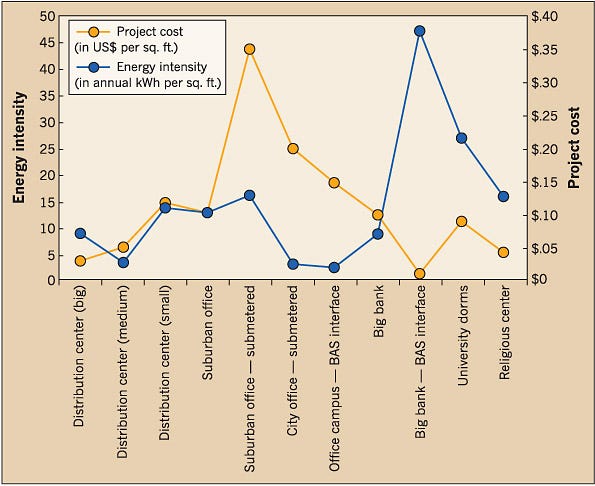
Figure 2 shows various building types where energy monitoring systems have been installed in recent years. It also lists the metric “annual electrical consumption per square foot,” which is useful in comparing the energy consumption of comparable buildings. The “energy monitoring project cost per square foot” is another metric building operations teams can use to analyze the impact on common area maintenance, CapEx, etc. It’s evident that the per square feet costs of designing and deploying an energy monitoring system is lower than other energy efficiency measures noted earlier, but the impact is more pronounced and measurable than the rest.
In terms of project duration, a probable estimate for an energy monitoring job is two to four months from concept to cash. Duration varies because the data acquisition system (DAS) is typically custom designed for a project. The explosion in the Internet of Things (IoT), reducing costs of processors, and subscription-based models to store and process data on the cloud, is reducing the installation costs of energy monitoring systems even further. The bottom line is information is power. If you have access to critical energy use information, you can find problems in your facility’s existing systems and make improvements to save energy right away.

Article was originally published on Electrical Construction & Maintenance.
You May Also Like


